Preliminary Bridge Girder Comparisons (pg. 2)
All information generated from the computer program is summarized and placed in a report for presentation to the engineer. Relative cost indices are included for all schemes (Figure 2).
FIG. 2
Cost and Weight Index Summary
| Scheme |
Design Method |
Spans |
Material |
Stiff. |
Web |
Girder Spacing |
No. of Girders |
Wt. Each Girder (lbs) |
WT. all Girders (tons) |
WT. Index |
Cost Index |
| A |
LFD |
3@127' |
A572 |
T |
63 X V |
12.00' |
7 |
97080 |
340 |
1.35 |
1.21 |
| B |
LFD |
[email protected]' |
A572 |
T |
60 X V |
12.00' |
7 |
71816 |
251 |
1.00 |
1.00 |
| C |
WSD |
[email protected]' |
A572 |
T |
60 x V |
12.00' |
7 |
75754 |
265 |
1.05 |
1.03 |
| D |
LFD |
[email protected]' |
A36 |
T |
63 x V |
12.00' |
7 |
85757 |
300 |
1.19 |
1.05 |
| E |
LFD |
[email protected]' |
A572 |
T |
42 x V |
10.50' |
8 |
72713 |
291 |
1.16 |
1.11 |
From this information, designers can make economic comparisons between their numerous options. Some typical comparisons include the following:
- Unpainted A588 versus painted A572
- Load Factor Design versus Allowable Stress Design
- Number of girders in cross-section
- Span arrangement
- Effects of depth restrictions
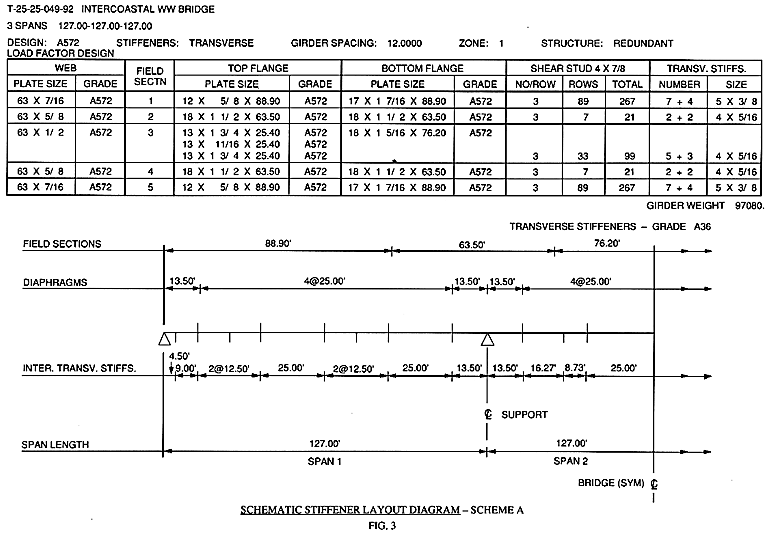
The optimum scheme is shown with complete detail and material listings (Figure 3).